this is the default thread for gerrymanders, for lack of a realistic alternative.This isn't an electoral map.
You are using an out of date browser. It may not display this or other websites correctly.
You should upgrade or use an alternative browser.
You should upgrade or use an alternative browser.
Alternate Electoral Maps II
- Thread starter Aaaaasima
- Start date
- Status
- Not open for further replies.
Threadmarks
View all 43 threadmarks
Reader mode
Reader mode
Recent threadmarks
Pericles-Obama landslide in 2008 Pericles-Obama does better in 2012 Tex Arkana-Carter runs a better campaign in 1976 and picks Frank Church as his running mate, winning in a landslide. DPKdebator-Trump landslide in 2016 wildviper121-Trump landslide based off of someone's Campaign trail game DPKdebator-The worst you can do as Hillary Clinton in the campaign trail game TheSaint1950-Last gallup poll in 1948 is right jonnguy2016-Trump self-sabotageThere are two additional maps that I have created for the New Rutherford Scenario. Earlier, I posted a map of the white vote by state in that scenario. This first map below depicts the white male vote by state in the same scenario:
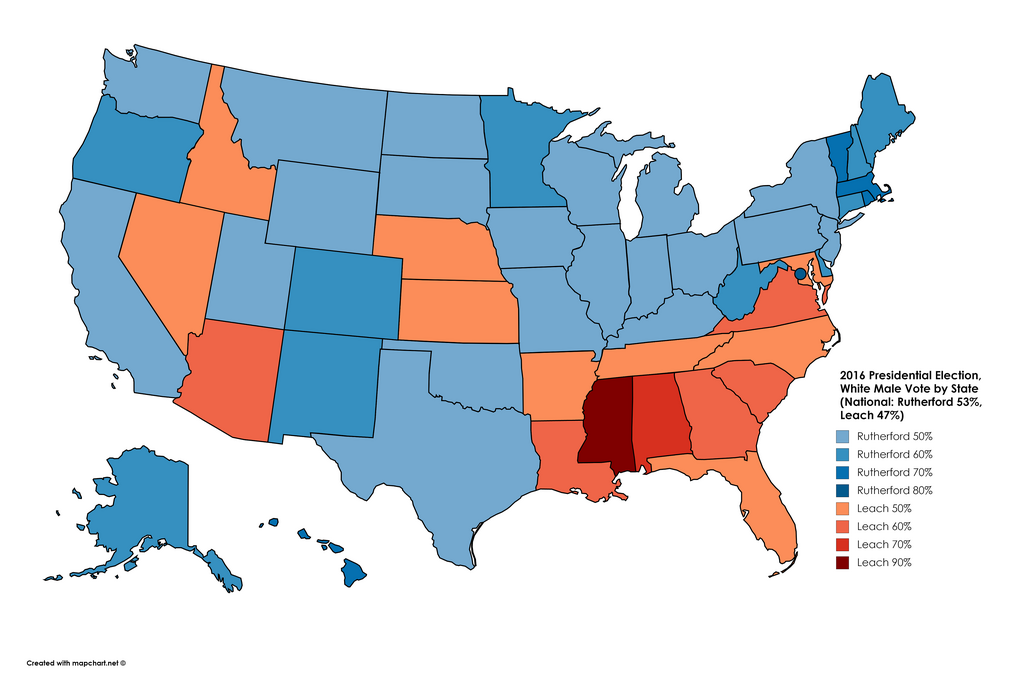
White men, as they are in OTL, are the most Republican voting bloc by gender in the country. Rutherford wins 52.97% of the white male vote. Leach carries the white male vote in sixteen states, including states such as Idaho, Maryland, Kansas, Nebraska, and Nevada, where Rutherford won the white vote overall. He gets over 60% of white men in Arizona, Georgia, Louisiana, South Carolina, and Virginia, over 70% in Alabama, and over 90% in Mississippi. Rutherford gets over 60% of white men in Alaska, Colorado, Connecticut, Delaware, Maine, Minnesota, New Hampshire, New Mexico, Oregon, and West Virginia, over 70% in Hawaii, Massachusetts, Vermont, and Rhode Island, and over 80% in the District of Columbia. Leach pulls over 40% in every other state, and comes very close to winning white men in states such as Oklahoma (49%) and Texas (48%).
White men, as they are in OTL, are the most Republican voting bloc by gender in the country. Rutherford wins 52.97% of the white male vote. Leach carries the white male vote in sixteen states, including states such as Idaho, Maryland, Kansas, Nebraska, and Nevada, where Rutherford won the white vote overall. He gets over 60% of white men in Arizona, Georgia, Louisiana, South Carolina, and Virginia, over 70% in Alabama, and over 90% in Mississippi. Rutherford gets over 60% of white men in Alaska, Colorado, Connecticut, Delaware, Maine, Minnesota, New Hampshire, New Mexico, Oregon, and West Virginia, over 70% in Hawaii, Massachusetts, Vermont, and Rhode Island, and over 80% in the District of Columbia. Leach pulls over 40% in every other state, and comes very close to winning white men in states such as Oklahoma (49%) and Texas (48%).
Last edited:
And here is the second map, depicting the white female vote by state in the New Rutherford Scenario:
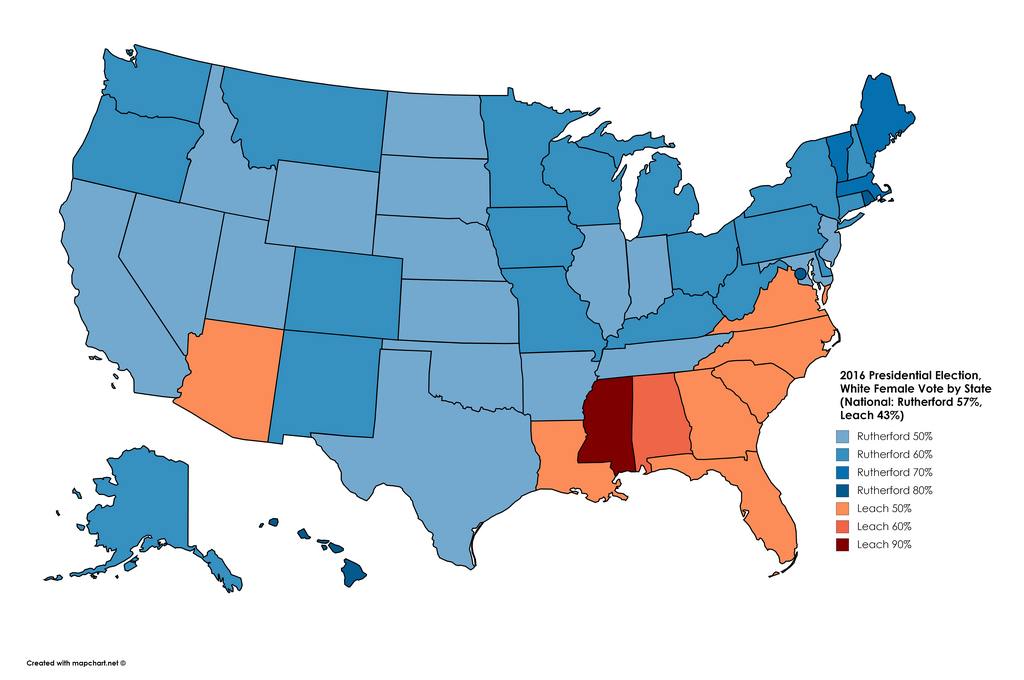
As you can see, the gender gap is evident within this timeline, though not to the same extent as in OTL (it is ~4 points here, as compared to 10 points in OTL). Rutherford wins 57.41% of the white female vote. Leach carries white women in 9 states: Alabama, Arizona, Florida, Georgia, Louisiana, North Carolina, Mississippi, South Carolina, and Virginia. He breaks 60% in Alabama and 90% in Mississippi. Rutherford gets over the 60% mark among white female voters in 20 states, over 70% in three states (Maine, Massachusetts, and Vermont), and over 80% in two states (Hawaii and Rhode Island), as well as in the District of Columbia. Notably enough, Rutherford wins white women in Arkansas and Tennessee, states where the white vote went for Leach overall, and as noted earlier, he carries the white vote in Idaho, Kansas, Maryland, Nebraska, and Nevada thanks to white women. Leach loses white women by fourteen percentage points (57-43%), as compared to losing white men by five percentage points (53-47%). He loses the overall white vote by ten percentage points (55-45%).
As you can see, the gender gap is evident within this timeline, though not to the same extent as in OTL (it is ~4 points here, as compared to 10 points in OTL). Rutherford wins 57.41% of the white female vote. Leach carries white women in 9 states: Alabama, Arizona, Florida, Georgia, Louisiana, North Carolina, Mississippi, South Carolina, and Virginia. He breaks 60% in Alabama and 90% in Mississippi. Rutherford gets over the 60% mark among white female voters in 20 states, over 70% in three states (Maine, Massachusetts, and Vermont), and over 80% in two states (Hawaii and Rhode Island), as well as in the District of Columbia. Notably enough, Rutherford wins white women in Arkansas and Tennessee, states where the white vote went for Leach overall, and as noted earlier, he carries the white vote in Idaho, Kansas, Maryland, Nebraska, and Nevada thanks to white women. Leach loses white women by fourteen percentage points (57-43%), as compared to losing white men by five percentage points (53-47%). He loses the overall white vote by ten percentage points (55-45%).
Last edited:
I found this old Republican landslide map that I made, so I thought I'd post it. what states do you think the Democrat wins here?

I found this old Republican landslide map that I made, so I thought I'd post it. what states do you think the Democrat wins here?
George Wallace or Strom Thurmond.
DC, Alabama, Arkansas, Georgia, Louisiana, South Carolina, Minnesota, West Virginia. I'm not sure about Illinois - Cook county seems too weak. Unsure also about Massachusetts, Missouri, Florida and Tennessee. Texas is also a bit strange with the Democratic Dallas
Nah. I imagined it as a 90s election. not sure who the candidates were supposed to be but maybe something like Zell Miller vs. Olympia Snowe in '92 after Dukakis wins in 1988.George Wallace or Strom Thurmond.
The Democrat only wins 6 states + DC (Louisiana, Mississippi, Alabama, Georgia, South Carolina, and West Virginia). in Minnesota the Republican wins by about 3%. Arkansas is roughly R+5, Illinois is R+3 (big Republican margins out of the collar counties plus the Democrat only wins Cook County by low double digits), Massachusetts is the 2010 Senate Special Election. Missouri is about R+2 or 3. Florida easily goes Republican due to the Democratic candidate's main strength being in North Florida. Tennessee is the 2006 Senate election where Harold Ford (D) lost by slightly less than 3%. as for Texas, it's a statewide election from 2002 but I can't remember which one off hand. The Republican wins by 6%.DC, Alabama, Arkansas, Georgia, Louisiana, South Carolina, Minnesota, West Virginia. I'm not sure about Illinois - Cook county seems too weak. Unsure also about Massachusetts, Missouri, Florida and Tennessee. Texas is also a bit strange with the Democratic Dallas
The Democrat only wins 6 states + DC (Louisiana, Mississippi, Alabama, Georgia, South Carolina, and West Virginia). in Minnesota the Republican wins by about 3%. Arkansas is roughly R+5, Illinois is R+3 (big Republican margins out of the collar counties plus the Democrat only wins Cook County by low double digits), Massachusetts is the 2010 Senate Special Election. Missouri is about R+2 or 3. Florida easily goes Republican due to the Democratic candidate's main strength being in North Florida. Tennessee is the 2006 Senate election where Harold Ford (D) lost by slightly less than 3%. as for Texas, it's a statewide election from 2002 but I can't remember which one off hand. The Republican wins by 6%.
Ahhh. Interesting map. The combination of North Florida strength and solid Democrat performance in Miami threw me there. I dropped the ball on Mississippi, and to a lesser Arkansas - I see them both now. What's the North Carolina margin? And do you remember the map's back story?
North Carolina is about R+4.85%, I believe.Ahhh. Interesting map. The combination of North Florida strength and solid Democrat performance in Miami threw me there. I dropped the ball on Mississippi, and to a lesser Arkansas - I see them both now. What's the North Carolina margin? And do you remember the map's back story?
I can't remember really what I had in mind at the time, but it's an election from the 90s where a popular moderate northeastern Republican defeats a centrist Democrat from the Deep South.
Interesting map. I'm pretty sure JFK wouldn't agree to be the running mate for a hardcore segregationist though, also I think Stennis would do even worse in the North than you have him doing and even better in the Deep South. also, I'm not sure why he does so well out West, especially with Nixon as Rocky's running mate.The 1960 election from "A World of Laughter, A World of Tears".


I'd assume Harris has the most delegates here?2020 Dem Primary, going to a brokered convention
View attachment 416811
Green: Bernie Sanders
Yellow: Elizabeth Warren
Blue: Joe Biden
Red: Kamala Harris
Purple: Amy Klobuchar
Zachary VIII
Banned
Bernie and Warren wouldn't run against each other.2020 Dem Primary, going to a brokered convention
View attachment 416811
Green: Bernie Sanders
Yellow: Elizabeth Warren
Blue: Joe Biden
Red: Kamala Harris
Purple: Amy Klobuchar
View attachment 416418
Every state is between 5.5 and 6.5 million.
Alaska is part of the Portland state. Hawaii is part of the Sacremento state.
mwahahahahahahahahahahhahahahaha
Cool map.
I'd recommend a few tweaks.
- Swap Iowa out of Minnesota for North Dakota. It keeps Iowa whole and likely No Dak too.
- You got a weird Houston/Austin thing going on. I'd make Greater Houston stretch along the coast and see if you can make a Greater Austin/San Antonio/vicinity work.
- I'd rotate the borders for Michigan, Indiana, NW Ohio, and Cincinnati/Kentucky. Keeping the Detroit metro whole. You might need to give SW Michigan to Indiana though and Dayton to Kentucky.
.
Those tweaks ultimately undermine the gerrymander aspect of the map (which results in over two-thirds of states voting D, and probably a majority going D by 6%+. I did consider ND+MN but that ultimately results in a Trump-voting state. Better to take ancestrally D NE IA.Cool map.
I'd recommend a few tweaks.
I have an old map like this somewhere, mostly done. I'll see if I can find it.
- Swap Iowa out of Minnesota for North Dakota. It keeps Iowa whole and likely No Dak too.
- You got a weird Houston/Austin thing going on. I'd make Greater Houston stretch along the coast and see if you can make a Greater Austin/San Antonio/vicinity work.
- I'd rotate the borders for Michigan, Indiana, NW Ohio, and Cincinnati/Kentucky. Keeping the Detroit metro whole. You might need to give SW Michigan to Indiana though and Dayton to Kentucky.
.
Another thing - it really stretches the math to have all of the Rio Grande Valley, San Antonio, and Austin all in one seat. El Paso is also an important source of D votes - Hillary got almost 70% there. (with 213k votes cast)
Austin-to-Houston is inevitable if one wants to use D votes efficiently.
I actually made one change to the map afterwards - I switched out Will County for most of the South Side, reducing the number of Romney-won states to 15. Trump still won Indiana under these lines, but the margin would be at least halved compared to OTL. (Perhaps Donnelly would have been favored to win even in a Clinton midterm - with all those 95%+ D areas in Chicago added in)
Keeping Metro Detroit also wastes D votes. I needed to pair it with some heavily R areas - Western OH did the trick.
I'm not going to pretend this is set of neutral lines. It's clearly skewed towards Ds, and puts Ds within reach of two-thirds majorities given enough luck.
A GOP version of this would be interesting - if a bit nastier by default (thanks to the need to breach state lines more), and the Midwest being tricky.
The state with most of Michigan was close in 2012 - being within less than a thousand votes. I could see Terri Lynn Land winning here in 2014.
Those tweaks ultimately undermine the gerrymander aspect of the map (which results in over two-thirds of states voting D, and probably a majority going D by 6%+. I did consider ND+MN but that ultimately results in a Trump-voting state. Better to take ancestrally D NE IA.
Another thing - it really stretches the math to have all of the Rio Grande Valley, San Antonio, and Austin all in one seat. El Paso is also an important source of D votes - Hillary got almost 70% there. (with 213k votes cast)
Austin-to-Houston is inevitable if one wants to use D votes efficiently.
I actually made one change to the map afterwards - I switched out Will County for most of the South Side, reducing the number of Romney-won states to 15. Trump still won Indiana under these lines, but the margin would be at least halved compared to OTL. (Perhaps Donnelly would have been favored to win even in a Clinton midterm - with all those 95%+ D areas in Chicago added in)
Keeping Metro Detroit also wastes D votes. I needed to pair it with some heavily R areas - Western OH did the trick.
I'm not going to pretend this is set of neutral lines. It's clearly skewed towards Ds, and puts Ds within reach of two-thirds majorities given enough luck.
A GOP version of this would be interesting - if a bit nastier by default (thanks to the need to breach state lines more), and the Midwest being tricky.
The state with most of Michigan was close in 2012 - being within less than a thousand votes. I could see Terri Lynn Land winning here in 2014.
Got it. It's a purposeful gerrymander. Which is why so many metros are split. Mine was more regional and centered around a common area. I'll keep trying to find it.
.
Bernie and Warren wouldn't run against each other.
I disagree. They both look like they are running in 2020.
Threadmarks
View all 43 threadmarks
Reader mode
Reader mode
Recent threadmarks
Pericles-Obama landslide in 2008 Pericles-Obama does better in 2012 Tex Arkana-Carter runs a better campaign in 1976 and picks Frank Church as his running mate, winning in a landslide. DPKdebator-Trump landslide in 2016 wildviper121-Trump landslide based off of someone's Campaign trail game DPKdebator-The worst you can do as Hillary Clinton in the campaign trail game TheSaint1950-Last gallup poll in 1948 is right jonnguy2016-Trump self-sabotage- Status
- Not open for further replies.
Share: